DeLamar Project Global (DeLamar + Florida Mountain) Gold and Silver Reserves
Table 1 shows the updated Mineral Resource estimate included in the PFS.
Table 1: Mineral Resource Estimate
| Oxide | Mixed | Non-Oxide | ||||||||||
| Florida Mountain | Measured | Indicated | Meas+ Ind | Inferred | Measured | Indicated | Meas+ Ind | Inferred | Measured | Indicated | Meas+ Ind | Inferred |
| K Tonnes | 1,361 | 14,302 | 15,663 | 4,516 | 5,498 | 34,098 | 39,596 | 5,292 | 2,119 | 16,009 | 18,128 | 4,663 |
| g Au/t | 0.39 | 0.36 | 0.36 | 0.25 | 0.47 | 0.39 | 0.40 | 0.28 | 0.40 | 0.44 | 0.43 | 0.32 |
| K Ozs Au | 17 | 164 | 181 | 37 | 82 | 425 | 507 | 48 | 27 | 225 | 252 | 48 |
| g Ag/t | 13.7 | 9.7 | 10.1 | 6.6 | 14.6 | 10.1 | 10.7 | 6.6 | 10.9 | 10.5 | 10.5 | 9.0 |
| K Ozs Ag | 599 | 4,467 | 5,066 | 958 | 2,584 | 11,064 | 13,648 | 1,126 | 741 | 5,399 | 6,140 | 1,343 |
| DeLamar Deposit | ||||||||||||
| K Tonnes | 2,846 | 25,939 | 28,785 | 5,163 | 3,490 | 27,556 | 31,046 | 2,631 | 13,729 | 53,301 | 67,030 | 18,350 |
| g Au/t | 0.34 | 0.31 | 0.32 | 0.26 | 0.42 | 0.33 | 0.34 | 0.29 | 0.53 | 0.46 | 0.48 | 0.42 |
| K Ozs Au | 31 | 262 | 293 | 44 | 47 | 290 | 337 | 25 | 234 | 793 | 1,027 | 250 |
| g Ag/t | 17.7 | 17.0 | 17.1 | 11.1 | 37.3 | 23.0 | 24.6 | 11.4 | 37.2 | 26.5 | 28.7 | 17.2 |
| K Ozs Ag | 1,616 | 14,170 | 15,786 | 1,838 | 4,181 | 20,337 | 24,518 | 967 | 16,407 | 45,403 | 61,810 | 10,126 |
| Total DeLamar Project | ||||||||||||
| K Tonnes | 4,207 | 40,241 | 44,448 | 9,679 | 8,988 | 61,654 | 70,642 | 7,923 | 15,848 | 69,310 | 85,158 | 23,013 |
| g Au/t | 0.36 | 0.33 | 0.33 | 0.26 | 0.45 | 0.36 | 0.37 | 0.28 | 0.51 | 0.46 | 0.47 | 0.40 |
| K Ozs Au | 48 | 426 | 474 | 81 | 129 | 715 | 844 | 73 | 261 | 1,018 | 1,279 | 298 |
| g Ag/t | 16.4 | 14.4 | 14.6 | 9.0 | 23.4 | 15.8 | 16.8 | 8.2 | 33.7 | 22.8 | 24.8 | 15.5 |
| K Ozs Ag | 2,215 | 18,637 | 20,852 | 2,796 | 6,765 | 31,401 | 38,166 | 2,093 | 17,148 | 50,802 | 67,950 | 11,469 |
Notes:
1 Gold equivalent = oz Au + (oz Ag / 79.07)
Table 3 shows the proven and probable reserves for both Heap Leach and Mill ore by deposit. The reserves were estimated using block value calculated based on metal price and recoveries by area and oxidation. The cost to process the material was then used as a cut-off grade. The metal prices used to calculate the block values were $1,600 per ounce gold and $21.00 per ounce silver, though the final cash-flow model used $1,700 per ounce gold and $21.50 per ounce silver. The block value calculation equation is shown in Equation 1 in the footnotes. The block value was calculated for both gold and silver and then each was added together to provide an overall value for each block.
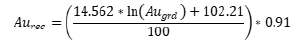
Recoveries used for the block value calculations are shown in Table 2 and were provided by Jack McPartland a member of MMSA, with a special expertise in metallurgy/processing, of McClelland Laboratories of Reno, Nevada. The recoveries for Florida Mountain Non-Oxide material used grade dependent equations shown in Equations 2 and 3 in the footnotes for gold and silver respectively.
Table 2 – Reserve Gold and Silver Recoveries
| Oxide | Mixed | Non-Oxide | ||||
| Recoveries by Area | Au | Ag | Au | Ag | Au | Ag |
| Florida Mountain | 89% | 49% | 72% | 47% | Eq. 2 | Eq. 3 |
| Sullivan Gulch | 86% | 20% | 61% | 39% | 38% | 73% |
| DeLamar | 78% | 11% | 61% | 42% | 39% | 87% |
| Sommerset | 87% | 15% | 58% | 44% | 39% | 87% |
| Glen Silver | 70% | 18% | 63% | 30% | 28% | 64% |
| South Wahl | 77% | 37% | 50% | 74% | 39% | 87% |
| Milestone | 75% | 18% | 45% | 18% | 39% | 87% |
Table 3: Mineral Reserves
| Leach | Mill | Total | |||||||
| Florida Mountain | Proven | Probable | P&P | Proven | Probable | P&P | Proven | Probable | P&P |
| K Tonnes | 5,789 | 39,919 | 45,708 | 1,306 | 9,249 | 10,555 | 7,095 | 49,168 | 56,263 |
| g Au/t | 0.50 | 0.42 | 0.43 | 0.48 | 0.54 | 0.53 | 0.50 | 0.44 | 0.45 |
| K Ozs Au | 94 | 541 | 635 | 20 | 160 | 180 | 114 | 701 | 815 |
| g Ag/t | 16.02 | 10.73 | 11.40 | 12.24 | 12.27 | 12.26 | 15.32 | 11.02 | 11.56 |
| K Ozs Ag | 2,981 | 13,768 | 16,749 | 514 | 3,648 | 4,162 | 3,495 | 17,417 | 20,911 |
| Block Value | $ 24.75 | $ 20.18 | $ 20.76 | $ 26.72 | $ 29.37 | $ 29.04 | 25.12 | 21.91 | $ 22.31 |
| DeLamar Deposit | |||||||||
| K Tonnes | 5,247 | 41,285 | 46,533 | 6,016 | 14,672 | 20,688 | 11,263 | 55,958 | 67,221 |
| g Au/t | 0.41 | 0.35 | 0.36 | 0.69 | 0.63 | 0.65 | 0.56 | 0.43 | 0.45 |
| K Ozs Au | 69 | 471 | 540 | 133 | 299 | 432 | 202 | 770 | 972 |
| g Ag/t | 31.24 | 22.07 | 23.10 | 62.03 | 52.86 | 55.52 | 47.69 | 30.14 | 33.08 |
| K Ozs Ag | 5,270 | 29,290 | 34,560 | 11,998 | 24,934 | 36,931 | 17,268 | 54,223 | 71,491 |
| Block Value | $ 19.83 | $ 16.19 | $ 16.60 | $ 42.07 | $ 36.62 | $ 38.20 | 31.71 | 21.54 | $ 23.25 |
| Total DeLamar Project | |||||||||
| K Tonnes | 11,036 | 81,205 | 92,241 | 7,321 | 23,921 | 31,243 | 18,358 | 105,126 | 123,483 |
| g Au/t | 0.46 | 0.39 | 0.40 | 0.65 | 0.60 | 0.61 | 0.54 | 0.44 | 0.45 |
| K Ozs Au | 163 | 1,012 | 1,175 | 153 | 459 | 612 | 316 | 1,471 | 1,787 |
| g Ag/t | 23.25 | 16.49 | 17.30 | 53.15 | 37.16 | 40.91 | 35.18 | 21.20 | 23.27 |
| K Ozs Ag | 8,251 | 43,058 | 51,310 | 12,511 | 28,582 | 41,093 | 20,763 | 71,640 | 92,403 |
| Block Value | 22.41 | 18.15 | $ 18.66 | 39.33 | 33.81 | $ 35.11 | 29.16 | 21.71 | $ 22.82 |
Notes:


Cautionary Note for U.S. Investors Concerning Mineral Resources and Reserves
National Instrument 43-101 - Standards of Disclosure for Mineral Projects (“NI 43-101”) is a rule of the Canadian Securities Administrators which establishes standards for all public disclosure an issuer makes of scientific and technical information concerning mineral projects. Technical disclosure contained in this news release has been prepared in accordance with NI 43-101 and the Canadian Institute of Mining, Metallurgy and Petroleum Classification System. These standards differ from the requirements of the U.S. Securities and Exchange Commission (“SEC”) and resource information contained in this press release may not be comparable to similar information disclosed by domestic United States companies subject to the SEC’s reporting and disclosure requirements.